Google Maps System Design
Google maps has surely made life easy for all of us hasn’t it. Whether it is to explore a new city, planning a road trip, find the quickest route to the airport, avoid traffic on the way to office! Just type in your destination and you have the perfect route! Seems so simple!! But all that goes on in the background from typing your destination to getting your route is anything BUT simple. So let's have a look at what does go on behind the scenes. Lets design Google Maps today!
Functional Requirements
- To be able to identify roads and routes
- Find distance and ETA while travelling between 2 points
- Should be a pluggable model in case we want to build up on those good to have requirements
Non Functional Requirements
- High Availability - This system can never be down. We don’t want our users to get lost in the middle of nowhere.
- Good Accuracy - The ETA we predict should not deviate too much from the actual time of travel.
- Responds promptly - The response should be ready within a few seconds.
- Scalable - A system like google maps receives huge number of requests per second, so it should be designed in a way that it can handle these requests and any surges in the number of requests.
Challenges while building
- There are millions of roads across the globe. It is a massive data set and not very easily available. Maybe not even very accurate.
- Some attributes that can effect ETA are very unpredictable and can not be quantified like road quality, accidents, construction work, etc.
- Disputed Areas… but we will come back to this later.
The solution to most of these challenges lies in Dynamic Programming. And this is where we will introduce something called Segment.
Segment
A segment is a small area that we can operate on easily. For example, a city can be divided into hundreds of segments of size, let’s say, 1km X 1km. Each segment will have four coordinates and based on these coordinates we can identify which segment the user is in. We will map the globe into segments, find paths within these segments and keep building up our solution till we find the path between two required locations. Just to clarify here, when we say coordinates we mean latitude and longitude of the location. The easiest way to visualise a road network is as a graph, where each junction will be a node and each road will be an edge. Each edge can have multiple weights like distance, time, traffic etc. which we can use to find the shortest/quickest path. From this graph visualisation we can safely say there will be multiple paths between various points, so we will run any of the graph algorithms to find shortest paths between various points within the segment. Also to avoid recalculating these paths again and again, we will cache this information and we will call this shortest path a calculated edge or calculated path.

Exit of a Segment
We will also cache the distances and calculated edges of each vertex from exit points of the segment. Once we know the distance from segment exits we can easily calculate inter-segment distances.
When we are navigating inter-segment, it is important that we identify how many segments we need to consider for our algorithm, because we can’t run a Dijkstra’s for all the segments across the globe. To restrict the number of segments we use the aerial distance between the 2 points. Suppose aerial distance between points A and B is 10km, we can consider 10 segments across each direction i.e 400 segments, which is much better than the otherwise massive graph.
Once the number of segments is restricted, we can restrict our graph such that the exit points of each segment will become the vertices of the graph and the calculated paths between the two points and all the exit points will become the edges of the graph. Now all we need to do to find the route is run a Dijkstra’s on this graph.
Mega Segment
So we have now divided the map into segments and we know how to calculate inter-segment routes. But what if the route spans over thousands of segments. Running Dijkstra’s on this huge graph will be very time consuming. So we introduce another level of nesting called Mega Segments. We will now divide the map into mega-segments which will be further divided into segments. Similar to how we cached calculated edges between exit points for segments, we will also cache calculated paths between exit points for mega-segments and run dijktra’s on this graph of exit points of mega segments.
Now that we have a graph, how do we come up with weights for the edges? As we mentioned previously, our edges can have multiple weights. There can be -
- Distance
- ETA
- Average Speed
We will not consider traffic, weather etc as weights because the are not that easily quantifiable. Instead we will consider them as attributes that can effect the average speed. But now the question is how to update the route when traffic/weather conditions change? Any change in these attributes will change the average speed and in turn the ETA. As soon as the weight(ETA, avg speed) of the edges is impacted the computed paths are recalculated to come up with a new route. This recalculation is only done when the weight changes more than a threshold percentage. For eg, if the ETA changes by more than x%, we will recalculate the path, otherwise we will stick to the current route.
And that is the algorithm used by google maps to compute the route between two points. Now let us have a look at the system architecture.
System Architecture
For ease of understanding we will understand the architecture in two parts. First we will see how the users are connected to the application and how their location information is captured. In the next part we will see the architecture for navigation flow.
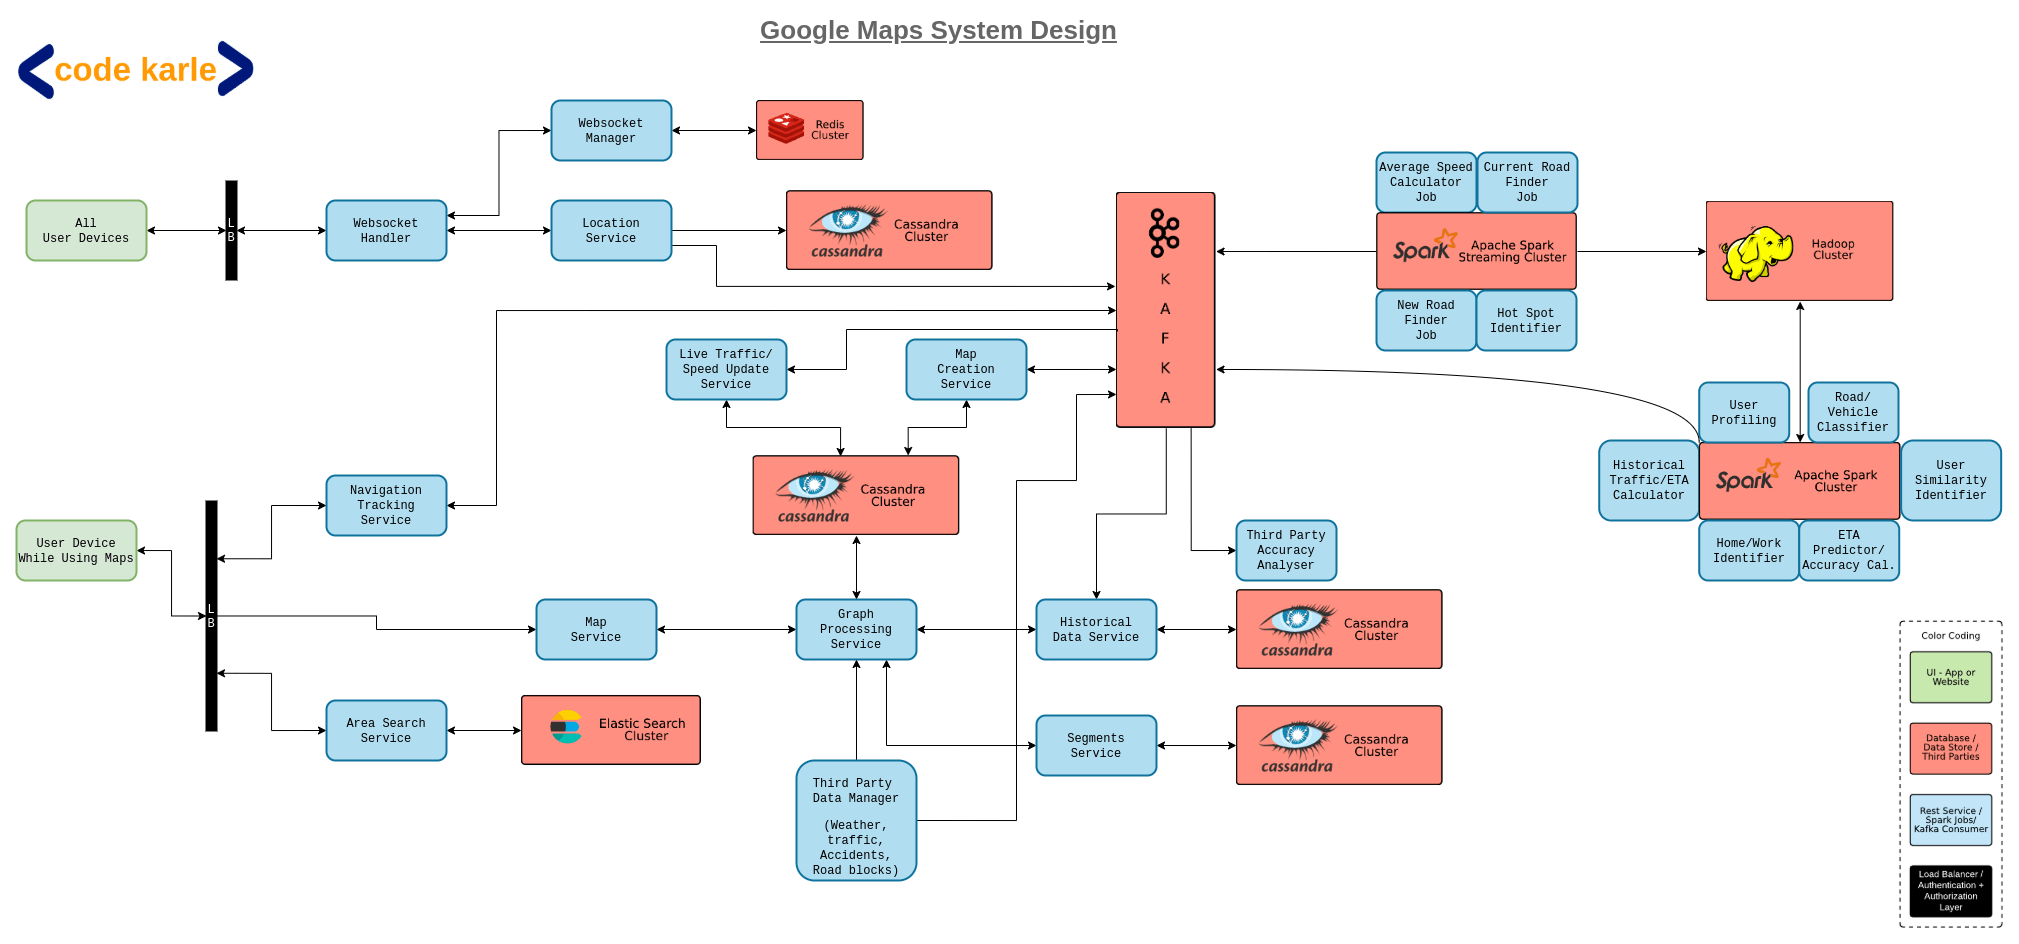
- Capturing user location information
- If the user’s location setting is On, we will get regular pings from them.
- We have a Web socket handler service that talks to all user devices.
- Due to the large number of users, one web socket handler is not enough for our system. Multiple Web socket handlers will talk to different users. A Web socket manager will keep track of which handler is talking to which device.
- A Redis which is connected to the web socket manager will store all this information.
- We have a location service which is a repo of all location related information that we collect from the users.
- The location service will store all this location permanently in a Cassandra data store.
- As we receive location pings from user, Location service will send pings to Kafka.
- All location pings coming into Kafka will be read by a spark streaming service, which can then use this information to add unidentified roads in our data, identify hot spots, identify change in avg speed etc.
- If a new road needs to be added, spark streaming service will send a ping to Kafka which in turn will tell the map update service. Map update service will update segments related information in Cassandra data store with the help of graph processing service.
- If spark streaming service identifies any change in avg speed it writes to Kafka which communicates with traffic update service.
- Traffic update service again talks graph processing service to recalculate the new paths and update in Cassandra data store.
- All this constantly flowing data to spark streaming service is also dumped in a Hadoop cluster from where it can be used for other jobs like user profiling, running ML algorithms to identify size of new roads, to identify how many two wheelers or four wheelers are travelling the road etc.

- User navigation flow
- An area search service will convert address or area searched by the user to lat long coordinates.
- A navigation service will keep track of user while they are travelling and send notifications if the user deviates from the suggested path.
- A map service will receive navigation requests from the users and forward it to the graph processing service.
- Graph processing service will talk to segment service which talks to Cassandra to get the segment related information.
- If the Graph processing service has the cached route, it will immediately respond back otherwise it will start processing further, for which it takes information from Cassandra.
- The Graph processing service will also receive notifications from third party data managers for live traffic, weather, accident related data. If this data is not available it might also query the historical data service for ETA.
- Historical data service will maintain ETA related info according to the days and hours in a Cassandra data store, which can be used to identify ETA when traffic related information is not available.
- Once GPS has a route it will communicate the response to the Map service will will further communicate with the user.
- Now through this flow Kafka has been constantly receiving events for each search.This data can be used to identify information like which are the popular areas, what are the most frequented areas for each users, etc. This data we can use to do some optimisations or even for user profiling. This data can also be used to identify hoe reliable our third party services are. For example, if the ETA as per our traffic service is does not match with the real time information we are recording from the user, then that service is not reliable.
- Kafka also interacts with the spark streaming service to runs some real time analytics like which road the user is on, which of our routes are unpopular etc.

And that is all from architecture point of view. I am sure you guys have some questions about why we are using which service like why Redis, why Cassandra, why Kafka. Well that is content for another article. We have written an article on Choosing The Best Storage Solutions For Your Requirements. You can go through it to understand when to use which databases or services and their alternatives.
Now if you remember when we discussed some of the challenges while building this system, we mentioned something called Disputed areas.
Disputed Areas...? What is that!
Let us consider the example of the dispute between the countries of India, China and Pakistan over the state of Kashmir. How does Google mark the boundaries of the state when Pakistan claims some part of the state belongs to them, China makes similar claims about another part of the state while India claims whole of Kashmir is under their jurisdiction. Here Google does something really cool. They mark the boundaries based on the country you are coming from! If the user is coming from India, whole of Kashmir will be marked as a part of India, where as if the user is travelling from Pakistan, the part that Pakistan claims to be under their territory is marked as Pakistan’s land and the part that is disputed between India and china is marked as a dotted line and same for China.
That should be it for Google Maps System Design! Send in your thoughts on our youtube video!